
Let’s Analyze: Dridex (Part 1)
Due to popular request I’m starting a new reverse engineering article series which will detail how I go about analyzing various samples, instead of just presenting my findings like I normally do. Most of the posts will be centered around IDA Pro (evaluation edition should work too) with WinDbg as a backend (you can use whatever backend you’re comfortable with). If you’re using something like Immunity or OllyDbg for malware analysis, I recommended following these posts anyway as you’ll soon see why it’s worth learning IDA. I should also add that I am by no means a professional, so if you have a better way to do something please leave a comment explaining your method. ## Starting Off
I actually got the loader binary off virustotal so didn’t have to deal with macros, but if you find yourself starting out with one of Dridex’s signature malicious word documents, you can follow this tutorial to retrieve the loader binary.
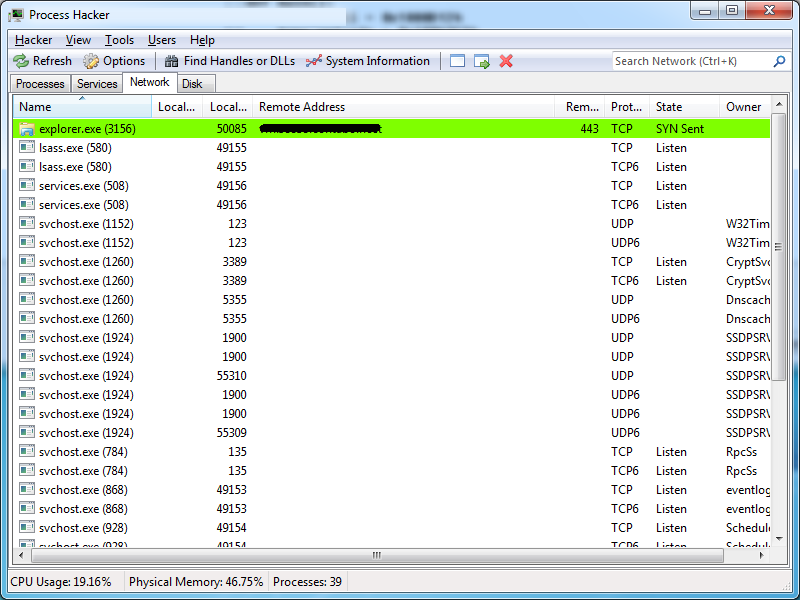
Dridex doesn’t have any anti-debugging or anti-VM features in any of the code aside from the macros, so we’ve got a work cut out. The first stage in my initial analysis is to simply run the malware on a virtual machine (I actually use a Windows VPS as they’re less likely to be picked up by VM detection because it usually targets VMware or VirtualBox, but a VM is fine.). Most malware these days checks into a C&C, so the easiest way to find the main process is to look for outbound connections, with Dridex this is as easy as opening Process Hacker and heading to the “Network” tab when running the binary.
|  |
|—|
| Dridex checking in to the C&C |
|
|—|
| Dridex checking in to the C&C |
As we can see above, explorer makes an outbound connection to a residential IP on port 443 (during first execution it will also bind port 443 or 8443). This is pretty good indicator of compromise (IoC) due to the fact explorer almost never makes connections; but, because it’s a favorite for malware to hide in, it can often be seen checking in to botnet C&C servers.
Now that we know the code is in explorer, we need to find it and get it out. One way to find injected code is to open the process in Process Hacker and visit the “Memory” page.

The thing that stands out here is the 200 mb RWX (readable, writable, executable) block of memory, this is another common IoC. Developers will rarely even leave pages that are executable and writable because it usually means an early lunch for exploit devlopers; furthermore, no common programming practices result in large RWX pages (Windows loads DLLs by allocating a block of pages with Copy-on-Write protection, writing the DLL, then setting the executable regions to be executable but not writable). Malware developers tend to be lazy and just allocate a bunch of RWX pages and dump the code there, so large blocks of RWX pages are commonly seen in malware, but almost never in software.
An alternate way we could find the malware’s memory would be with a bit of critical thinking. In this case I’ve already stated that explorer doesn’t normally make outbound connections but this malware does, so we can just attach a debugger and set a breakpoint on ws2_32!connect. Once the breakpoint is hit we can use the “k” WinDbg command to show the call stack and see where the call came from.
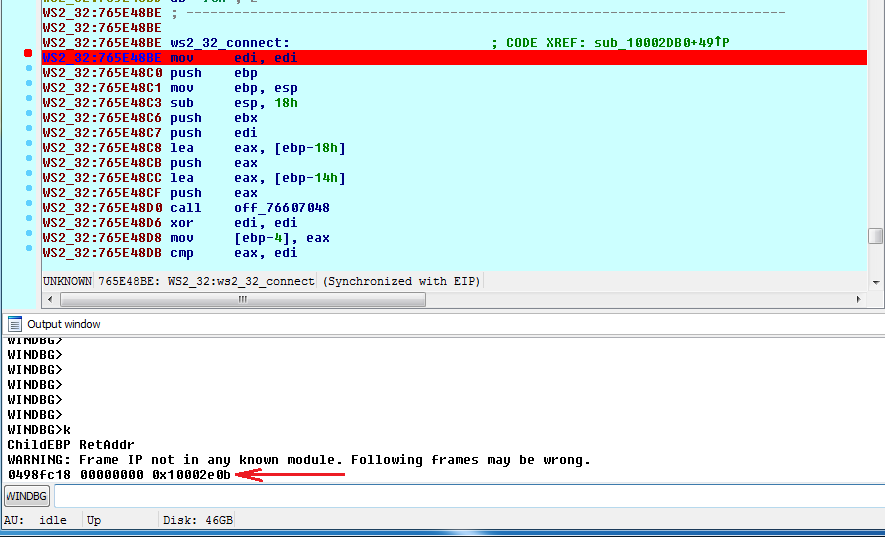
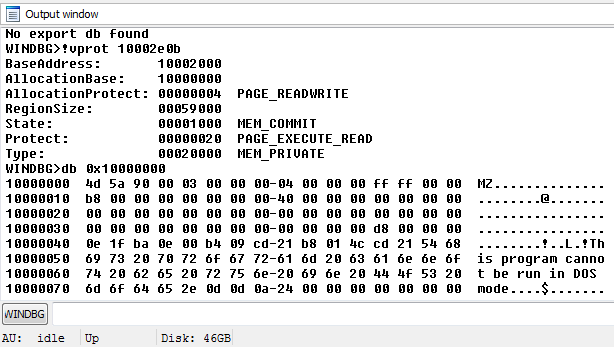
Interestingly enough the return address isn’t in the giant RWX region, but it is in a region close to it (likely also belonging to the malware). We can use the WinDbg command “!vprot” on the address to retrieve various information about it, most importantly the “Allocation Base” which needs some explaining.
When using functions like VirtualAlloc(Ex) or NtAllocateVirtualMemory to allocate memory, the kernel allocates in terms of pages. A page is a 4 KB block of memory, if you allocate 1 Byte of memory using one of the above functions you get 4 KB, if you allocate 6 KB you get two 4 KB pages in a row, you get the idea. When an allocation bigger than 4 KB is made (multiple pages), the “Allocation Base” for every page in the allocation will bet set to the start address of the first page, if some malware allocated a bunch of pages and wrote a PE file there, the allocation base would be the start of the DOS header.
 It is.
Now we know connect() was called from an address belonging to a block of pages starting at 0x10000000 and 0x10000000 is the start of a PE file, we can assume the malware is either and injected EXE or DLL, so all we need to do is dump it.
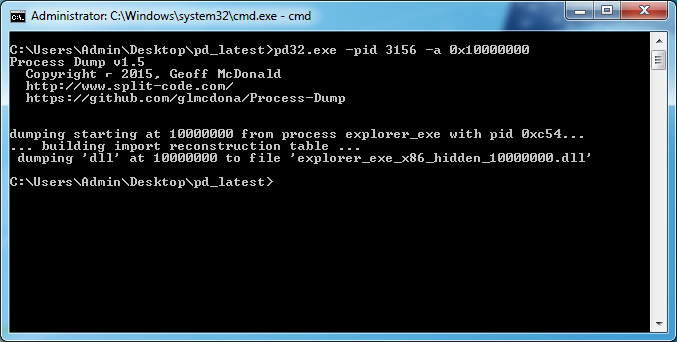
For this I use a tool called pd (Process Dump), you can download it here. All we need to do is run it with the parameters “-pid <explorer pid> -a <address where PE starts>” and we have the main, unpacked malware binary. A useful note: if the above methods fail, you can just run pd with the parameter “-pid <explorer pid>” which will dump all modules in explorer, marking any not present in the LDR table (Injected via PE injection) with hidden in the file name.
Now we can open the PE in IDA Pro.
Reversing The Injected Code
We don’t really want to reverse the code while it’s injected into explorer because each time we pause or hit a breakpoint the taskbar will freeze, luckily there’s a really easy solution for Dridex. All we need to do is copy some program like cmd.exe to a folder and rename it to explorer.exe, kill the real explorer, then run the sample using cmd.exe. Once we see the code has injected into our cmdsplorer (starts making connections to C&C), we can run the real explorer.
Something you may or may not know is that you can open a DLL in IDA and if the preferred base address of the DLL is the same as the address of the DLL loaded into a process, you can attach IDA to said process and it will link up the DLL in the IDA database with the DLL in memory, replicating any change such as comments and function names. With Dridex it appears the DLL is always loaded at the same address (in this case 0x10000000) which is also its preferred base address. We don’t need to change anything, just set IDA to use WinDbg debugger and attach to our cmdsplorer process.
First thing I usually do is search the imports page for functions like connect() or InternetOpen() as these are used for C&C communication, which is the first place I start reversing.
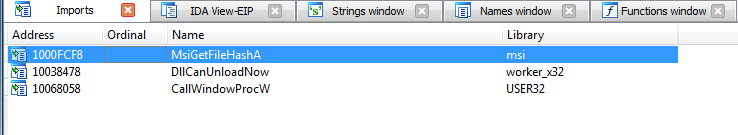
Well after reading through the extremely long list of imports, we can deduce that none of the 3 are of any real interest and no executable can run on those alone, so the main functions are probably loaded dynamically at runtime. Luckily we don’t have to do much legwork as we already know where one of the dynamically loaded functions is called from (the connect() return address from earlier), there would be a good place to start.
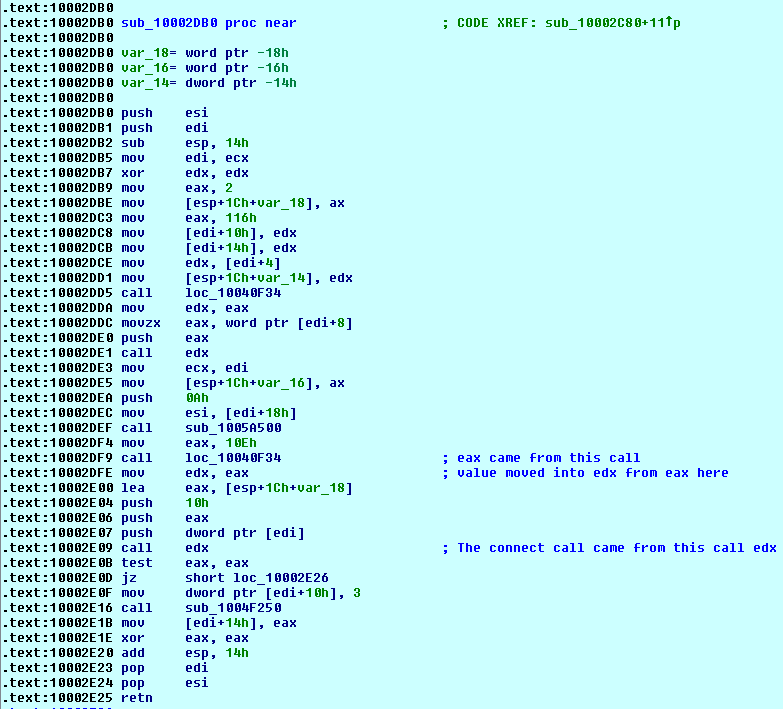
We can see that the function is definitely dynamically imported (call edx) and that the value in the edx register originated from loc_10030F34 as eax was set to 0x10E right before the call and that isn’t a valid address. As I’ve seen this technique in malware before, my first assumption is loc_10030F34 resolves the function every time it needs to be called, and that the value in eax prior to the call is an export ordinal or some kind of internal id for the function it needs to resolve. If we right click the function name and click on “jump to xrefs to operand”, we can see a list of every place it’s called from.

The fact the function is called from a thousand different places adds to the theory that it is called every time a function is needed, not just used to resolve them all at startup. We could manually reverse the function to see how it works then write down which id corresponds to which function, or we could cheat.## IDA Python
IDA python is the reason why I pick IDA over a plain debugger, you have the flexibility of python with the power of IDA’s API, allowing you to do pretty much anything you could ever want. For future references, here is the documentation page for the API.
<pre class="brush:python;" name="code">import idc
import idautils

function_names = []

def DumpNames():
    for name in function_names:
        print(name)

def BreakpointHandler():
    target = GetRegValue("EAX")
    name = NameEx(target, target)
    call_loc = PrevHead(GetRegValue("EIP"), 0)

    if name == "":
        name = atoa(target)

    if name not in function_names:
        function_names.append(name)

    MakeComm(call_loc, name)
    AddCodeXref(call_loc, target, fl_CN)

    print("Hit breakpoint: %x, call to: %s" % (GetRegValue("EIP"), name))
    DelBpt(GetRegValue("EIP"))

def main():
    xref = 0
    func = 0x10040F34 #Must be the address of the resolver function

    #Lets use python functions for breakpoint conditions
    RunPlugin("python", 3)

    for xref in idautils.XrefsTo(func):
        if xref.type == fl_CN:
            bpaddr = NextHead(xref.frm, 4294967295)
            AddBpt(bpaddr)
            SetBptCnd(bpaddr, "BreakpointHandler()")
            print("Breakpoint at: %x" % bpaddr)

if __name__ == '__main__':
    main()
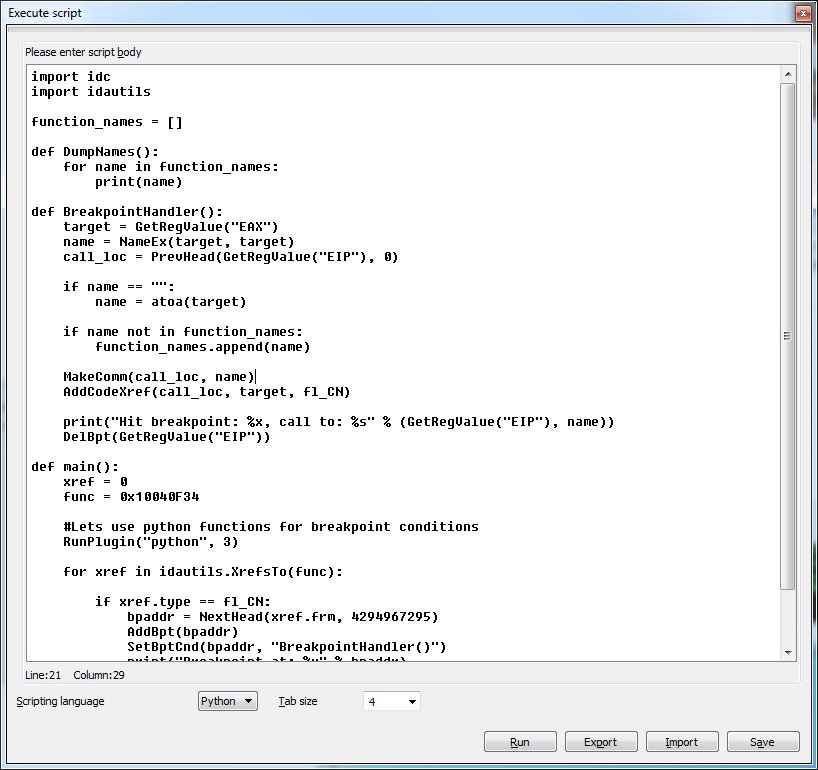
This is the script I wrote to get the names of every function that is resolved and where the call to resolve it came from, I’ll explain how each part works.
<pre class="brush:python;" name="code">for xref in idautils.XrefsTo(func):
<pre class="brush:python;" name="code">
Loops through ever XrefTo loc_10040F34 (place where loc_10040F34 is referenced from).
<pre class="brush:python;" name="code">if xref.type == fl_CN:
Makes sure the xref is a flow call near (a call to loc_10040F34).
<pre class="brush:python;" name="code">bpaddr = NextHead(xref.frm, 4294967295)
Gets the address of the instruction after the xref (after the call to loc_10040F34 where eax has already been set to the resolved function).
<pre class="brush:python;" name="code">AddBpt(bpaddr)
SetBptCnd(bpaddr, "BreakpointHandler()")
Adds a software breakpoint and sets the “breakpoint condition” to BreakpointHandler, which just means that function will be called every time the breakpoint is hit.
Now on to the BreakpointHandler:
<pre class="brush:python;" name="code">target = GetRegValue("EAX")
Get the value in the eax register (the resolved function).
<pre class="brush:python;" name="code">name = NameEx(target, target)
Get the name of the function (something like ws2_32_connect).
<pre class="brush:python;" name="code">call_loc = PrevHead(GetRegValue("EIP"), 0)
Get the instruction before the breakpoint (the call to loc_10040F34).
<pre class="brush:python;" name="code">if name == "":
    name = atoa(target)
If the name of the function couldn’t be resolved (it wasn’t an export), convert its address to a string.
<pre class="brush:python;" name="code">if name not in function_names:
    function_names.append(name)
If the resolved function hasn’t already been handled by us, add it to the list of functions we’ve processed.
<pre class="brush:python;" name="code">MakeComm(call_loc, name)
Comments the instance of “call loc_10040F34” with the name of the function it resolves.
<pre class="brush:python;" name="code">AddCodeXref(call_loc, target, fl_CN)
Add an Xref to the resolved function so that if we go to say ws2_32!connect and right click “Jump to xrefs to operand” we’ll see all the places in the code where loc_10040F34 is used to resolve ws2_32!connect.
<pre class="brush:python;" name="code">DelBpt(GetRegValue("EIP"))
Delete this breakpoint so we don’t get needlessly called over and over.
All we need to do is go to “File > Scripts” and paste the script, set the “Scripting language” field to python, then click run.
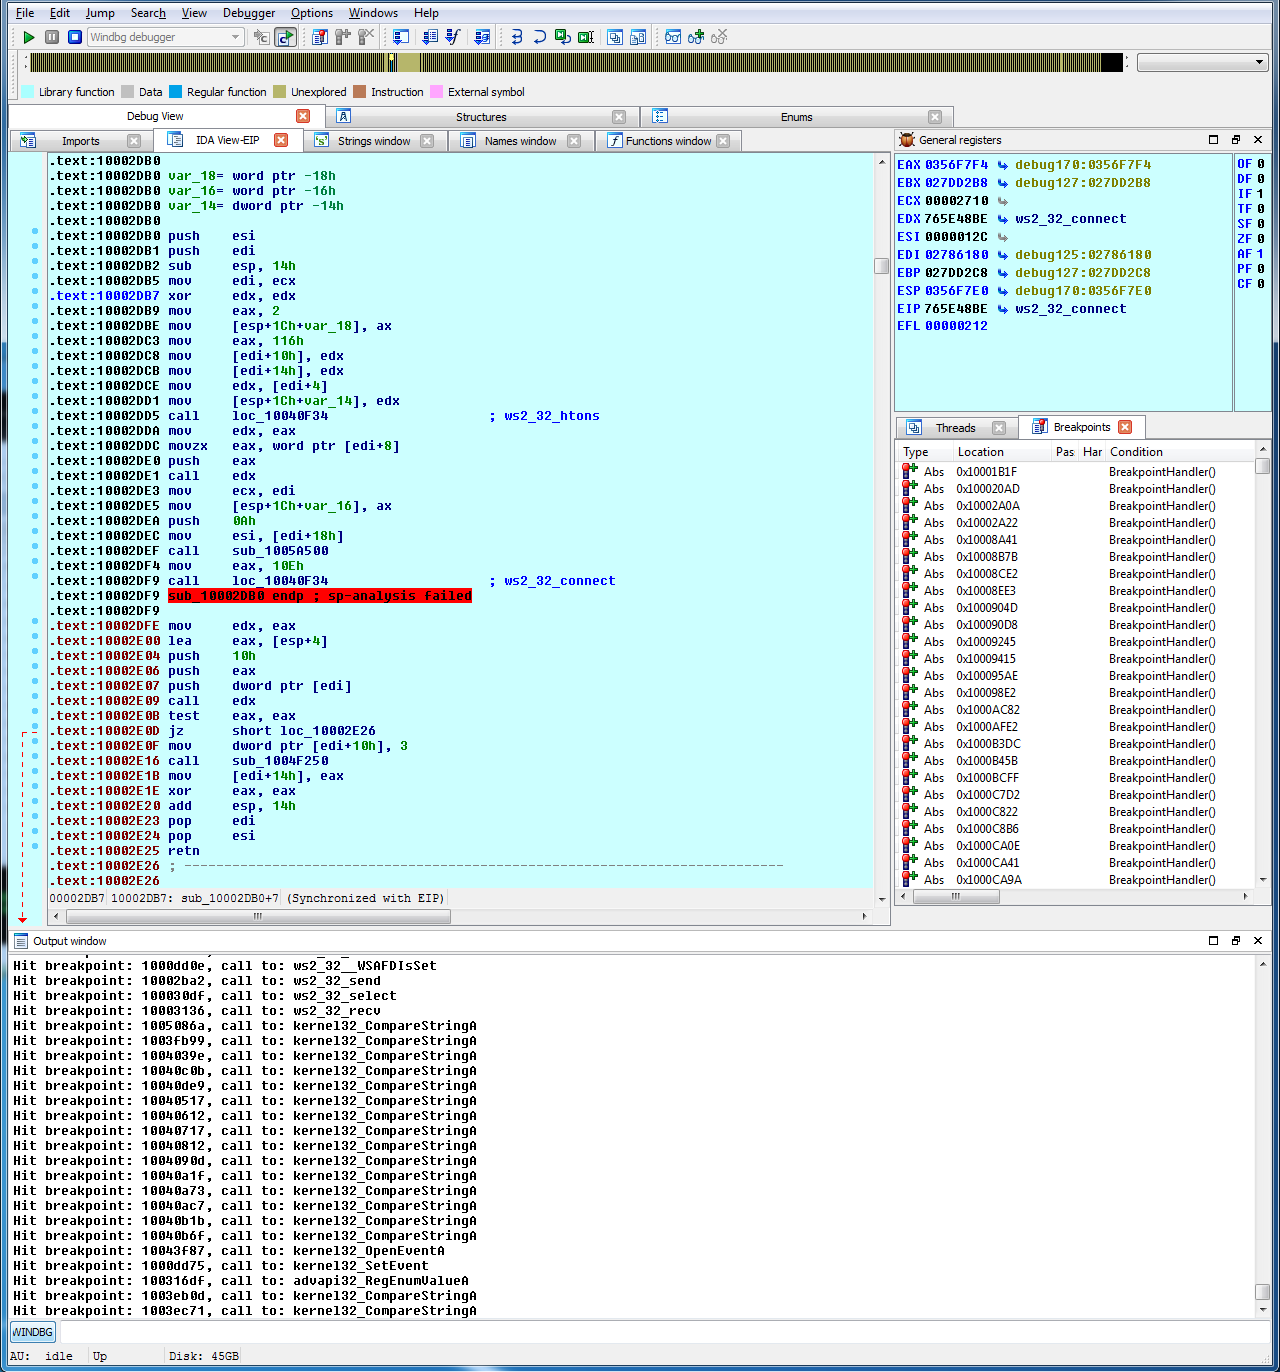
 Once we run the script, we’ll see output in the IDA output box and a load of new breakpoints.
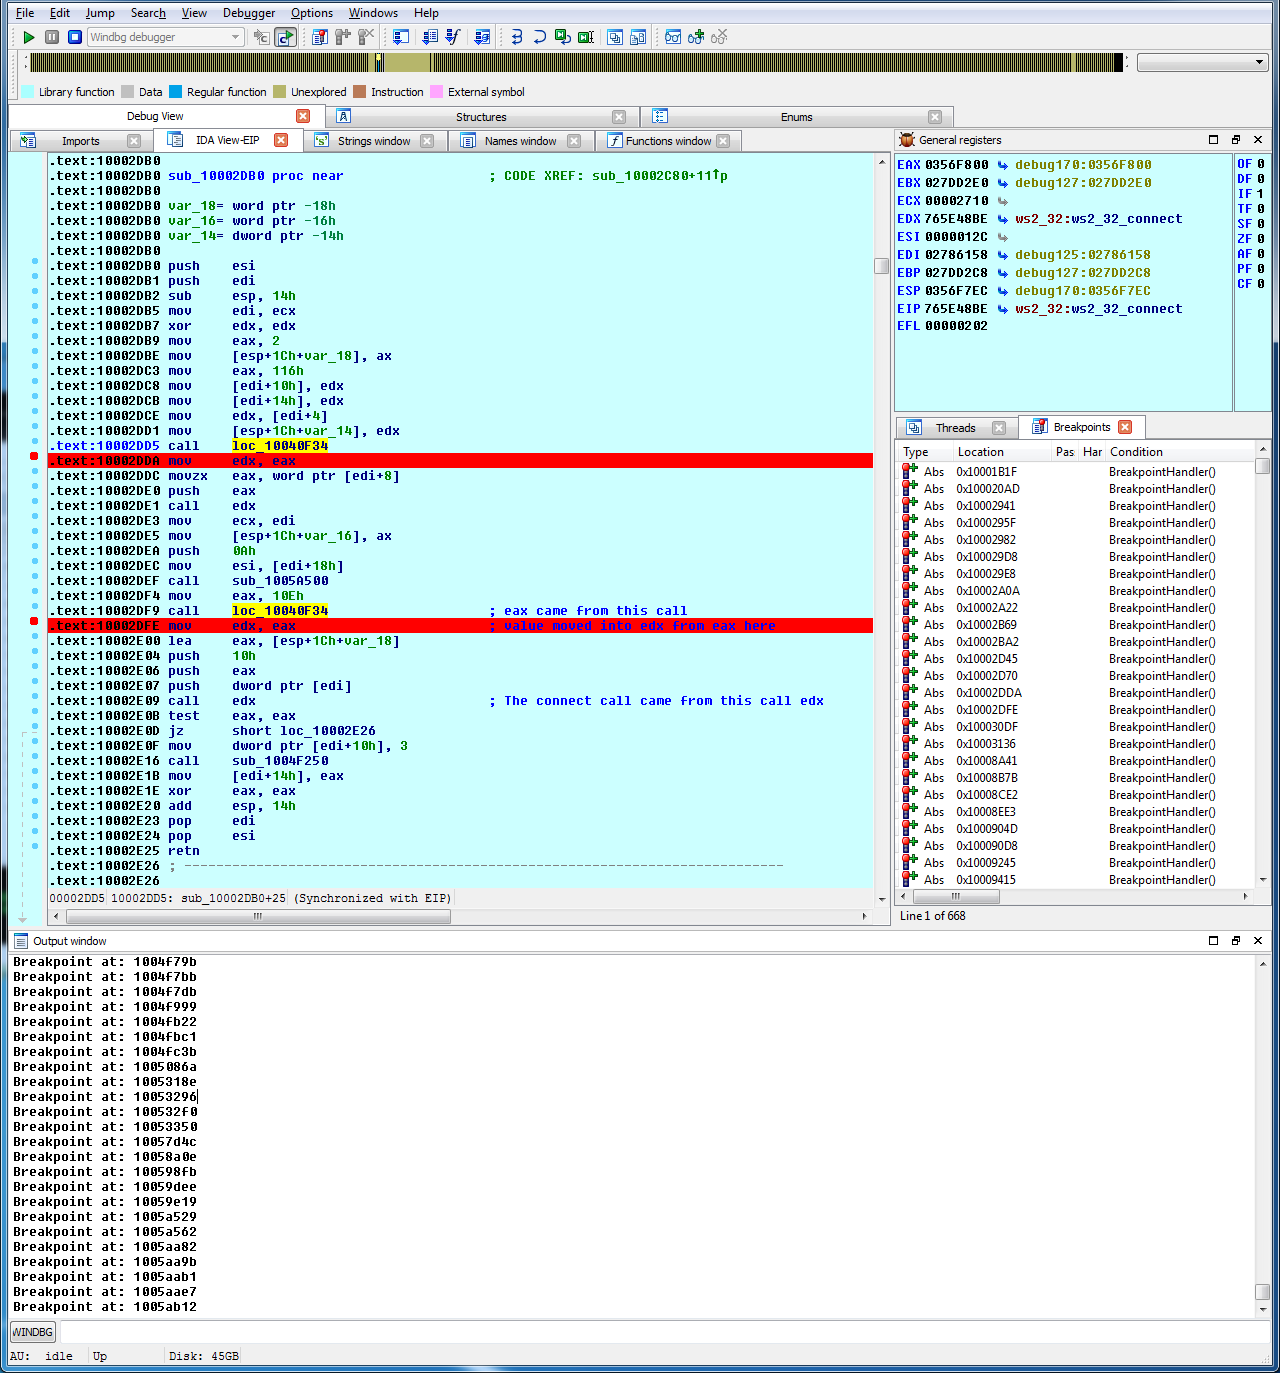 After clicking run and letting the debugger run for 20 minutes (C&C check in is ever 20 mins), most of the major functions will have been resolved. We can see that our call to connect has been automatically commented, making analysis much easier.
 If we set the console mode to python (click the button that says WINDBG), we can use the DumpNames() function in my script to get a nice list of every function called while the script was running.
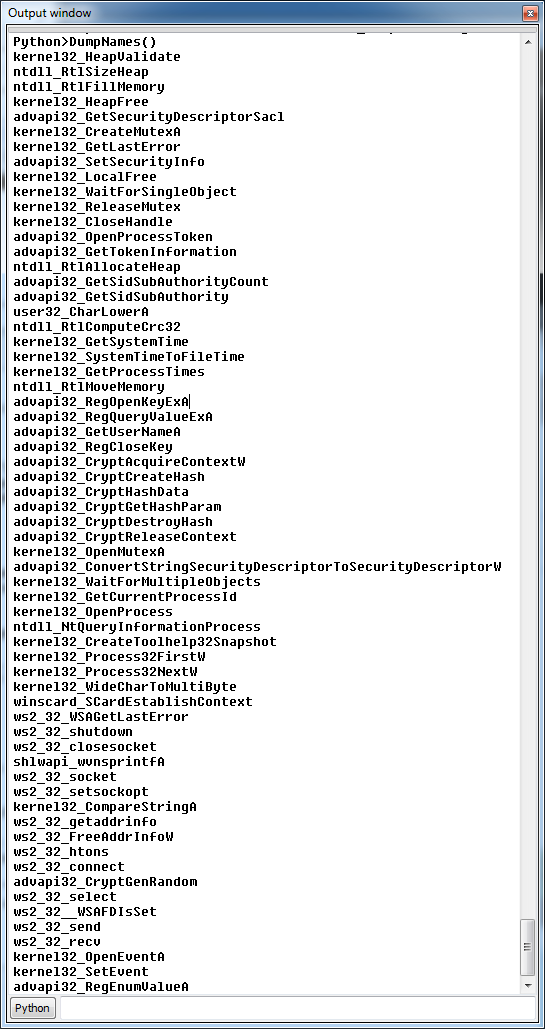 Wonderful!
I did previously try to have the script step through and find the “call <reg>” instruction and comment + xref that, but it prove to be incredibly slow and quite buggy, so I settled for just commenting the call to the resolver (it’s pretty easy to find the corresponding call if you need to). As well as using xrefs, you can find the comments by hitting ALT + T (search text) and entering the comment name (e.g. ws2_32_connect).
That’s all for today, in the next part I’ll show how to use a similar technique to locate and dump all the encrypted strings.

