
Let’s Analyze: Dridex (Part 3)
Sorry for the longer than expected delay, occasionally the Dridex group will take the servers offline during the weekend and resume normal operations on Monday; however, it appears they decided to take an extended break as the network went offline at some point a week ago, preventing me from fetching the payload. If like me you got caught out by the bot binary updating when the network came back online: you can dump the new DLL then use Diapora to copy labels, comments, and structs to the new IDA database. Since the last article you should have been able to dump all the strings and have a look at where they are used, specifically you should have found a large complex function using the majority of the strings.
 As you’ll notice from the above image, only one control path of the function is commented; this is because Dridex has multiple different message types (some of which are sent to the C2 and others sent to peers). Communication is at about 20 minute intervals, so in order for the script to comment all of the control paths you’d need to leave the binary running for a few hours, or figure out the function parameters and call it manually to invoke each control path (it’s up to you to decide which is the better option, personally I’d rather grab a cup of tea and go watch Netflix).
Although the function looks very complex, all it’s doing is calling the same few functions over and over to build an XML message based on some values. To dump the full message, simply plop a breakpoint at the end of the function and go to the address in EAX (EAX+0 is the pointer to the buffer and EAX+4 is the size), you can then dump it to file with the following WinDBG command: “.writemem C:pathtooutputfile.txt poi(eax) L poi(eax+4)”. Something to note is: with the writemem command the 3rd parameter is either the end address or the size (if prefixed with ‘L’).
As I said earlier, this function has many different control paths but here is an example of the output from the far left one.
<root>
<unique>PC-NAME-HERE_aaaaaaaaaaaaaaaaaaaaaaaaaaaaaaaa</unique>
<comp>bbbbbbbbbbbbbbbbbbbbbbbbbbbbbbbb</comp>
<botnet>220</botnet>
<version>196812</version>
<system>56384</system>
<type>bot</type>
<ip>1.1.1.1</ip>
<left key=”0″ req=”0″ />
<get_module name=”bot” bit=”32″ />
</root>
You can probably figure what most of the values are, but if you want to know the rest you’ll have to reverse the functions generating them (personally this is of little use to me, so I haven’t yet looked).
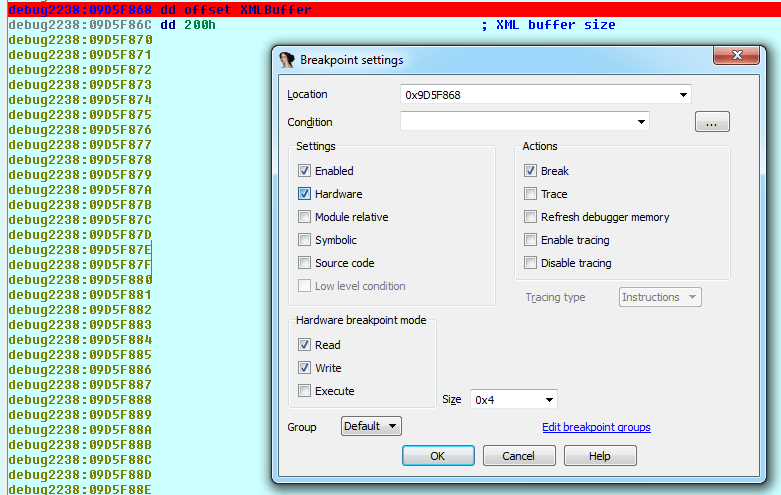
What you’ll want to do next is step until the function which builds the XML message returns to the function which called it, then you can start reversing to find out what is done to the message between creation and being sent to the C&C or peer. If you’re lazy like me, reversing that much code sounds like quite a bore, so you can use a little trick to skip straight to where the XML message next gets used: first give the parent function a name you’ll remember later (from now on we’ll refer to it as BuildXMLMessageParent), then put a R/W hardware breakpoint on the first byte of the XML message text, which will cause the debugger to break whenever the message is read or written.
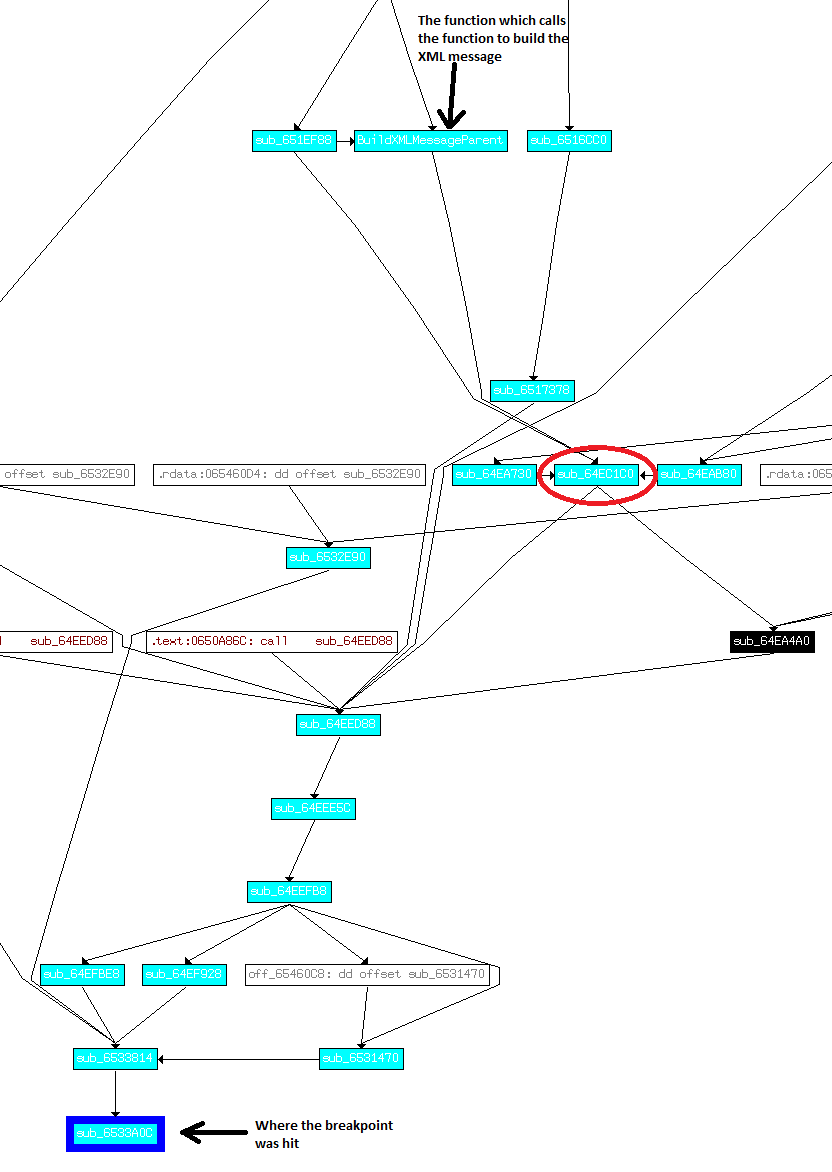
 When the breakpoint hits, you’ll either be in some random part of the bot’s code or a system library function. If you’re in any function which doesn’t reside inside the bot binary, use the windbg ‘K’ command to dump the call stack and look for a return address within the bot’s code, or if there isn’t one, just keep stepping through until you return to an address within the bot. Once you get there go to the top of the function right click and select “graph xrefs to”, this will show a graph of every function in the bot which calls the one we’re in, every function that calls that, and so on (all the way back to the entry point).
What you want to look for is where the the call path intersects with BuildXMLMessageParent, then you can look for the first call in the path (red circle), note down the address and go to the part of BuildXMLMessageParent’s code where that function is called. Now you have a start point to begin reversing and trying trying to figure out what functions in the call path do.
 This part is tricky for beginners who aren’t able to identify open source libraries, so I’ll give a hint: everything in the call path below sub_64EED88 is part of zlib.
A good way to deal with open source libraries like zlib is to see if you can figure what compiler was used for the bot, then download and compile the library to a DLL with the same or similar compiler and calling convention (make sure PDB generation is enabled). Once you’ve got the compiled DLL, open it with IDA (the PDB contains the names of all the internal non exported functions, which IDA can use to automatically name them in the project). You can use BinDiff (which is now free), to compare your library DLL’s IDA database with the bot one and look for close matches between the two (remember to save and close both databases before trying to pen them in BinDiff).
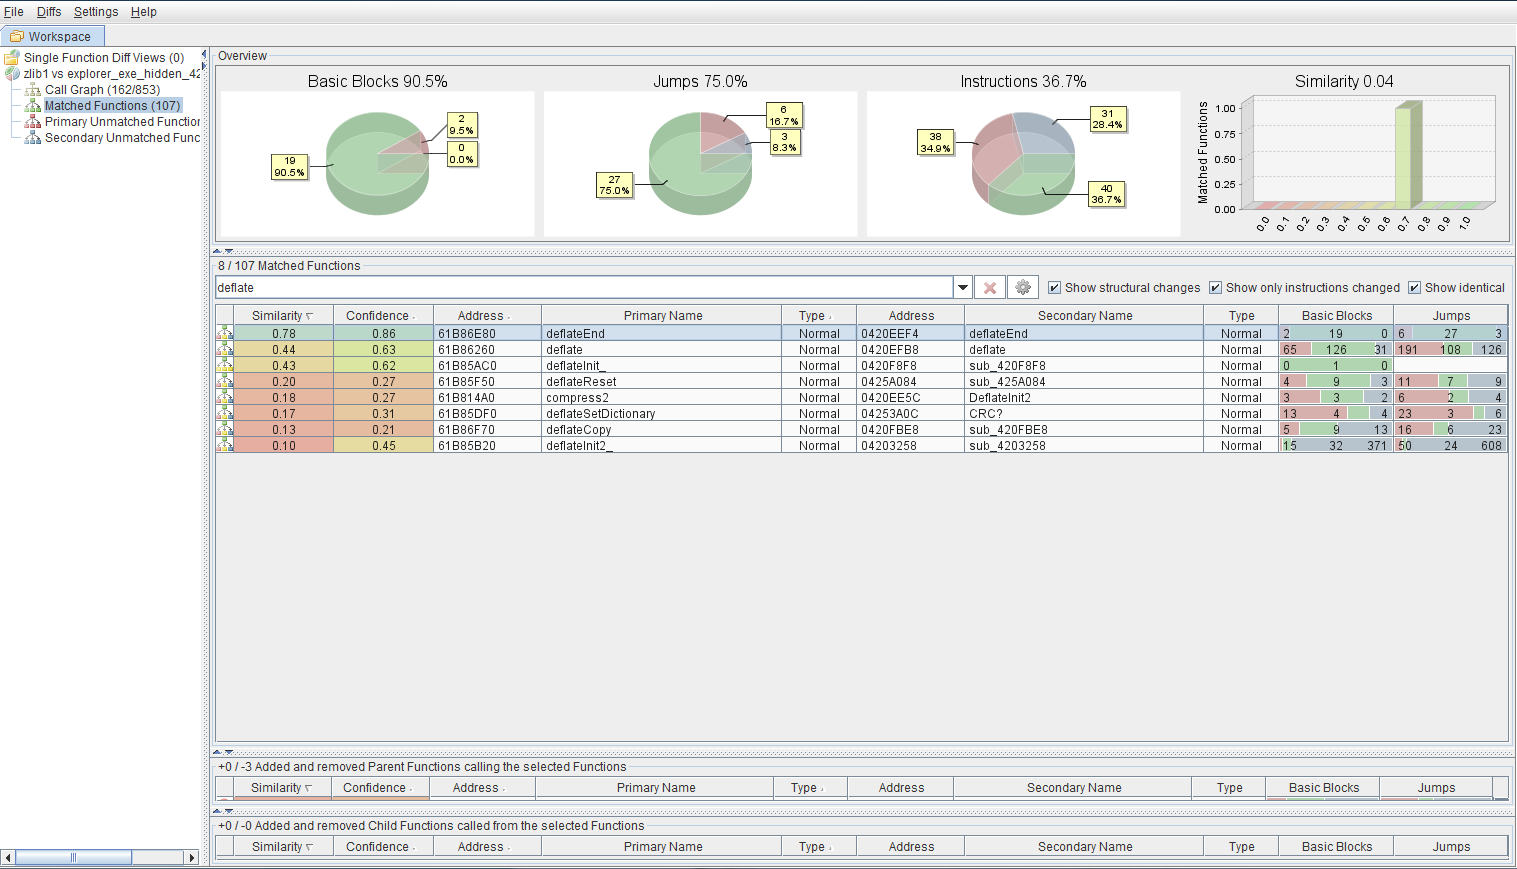 |
|---|
| Close matches between zlib functions and bot functions |
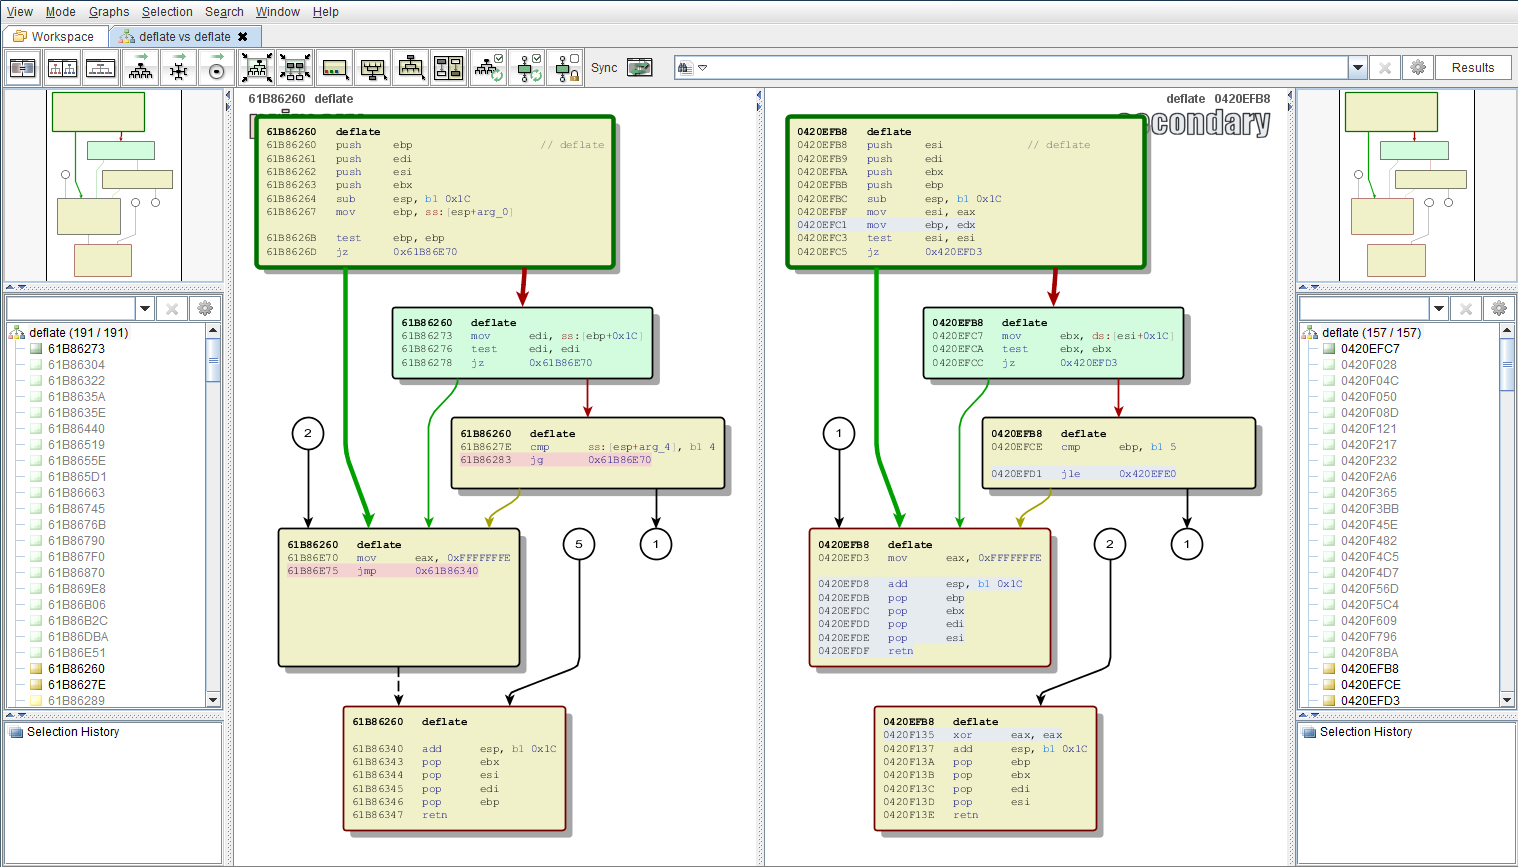 |
|---|
| Zlib’s deflate function (left) vs the bot’s implementation (right) |
As far as reversing techniques go, I think I’ve covered everything for the Dridex communication module; all that’s left is to step through and work out what happens to the data between its creation and being sent (which is just compression followed by a simple encryption). I haven’t really got any plans for what part to reverse next, if any, so feel free to leave your suggestions in the comments.

